Istio Service Mesh : Complete Setup
Posted in Recipe on July 13, 2022 by Venkatesh S ‐ 5 min read
Istio - Service Mesh for microservices deployment
Detailed process of setting up istio and related addons to ensure a complete microservice deployment using service mesh.
To run this example here are the pre-requisites
- You have a Kubernetes setup. Easiest option is to setup Rancher Desktop
- You have Helm, Docker CLI and kubectl. You get all of this if you install Rancher Desktop out of the box.
- You have atleast 6 CPUs and 8 GB of memory configured on Kubernetes to setup istio and all addons and deploy sample example provided.
Setting up Istio 1.14 version
Lets use Helm to setup Istio on our Kubernetes cluster. Here a quick preview on how the entire system is being setup.

We will be setting up istiod service (control plane), as and when the applications are deployed on an istio enabled namespace, envoy proxy would be dynamically injected. We will also setup istio ingress service.
Configure Helm Repository
Run the following commands from the command prompt.
helm repo add istio https://istio-release.storage.googleapis.com/charts

helm repo update
Installing Istio
Create the ‘istio-system’ namespace where istio will be installed.
kubectl create namespace istio-systemInstall the Istio base chart which contains cluster-wide resources used by the Istio control plane
helm install istio-base istio/base -n istio-systemInstall the Istio discovery chart which deploys the istiod service
helm install istiod istio/istiod -n istio-system
This will complete the setup of Istio.
Uninstalling Istio
Incase you want to uninstall istio, here are the commands for you
# delete istio and istio-system namespace
helm delete istiod -n istio-system

helm delete istio-base -n istio-system

kubectl delete namespace istio-system
For more details, visit istio installation section using helm charts.
Setting up Istio Addons (Integrations)
We will be setting up the following in the same order.
Setting up Jaeger
Jaeger - an open source end to end distributed tracing system, allowing users to monitor and troubleshoot transactions in complex distributed systems.
Run the following command to setup Jaeger.
kubectl apply -f https://raw.githubusercontent.com/istio/istio/release-1.14/samples/addons/jaeger.yaml
After the service is installed, run the following command to check that the pod related to Jaeger is running.
kubectl get pods -n istio-system
Setting up Prometheus
Prometheus - an open source monitoring system and time series database
Run the following command to setup Prometheus.
kubectl apply -f https://raw.githubusercontent.com/istio/istio/release-1.14/samples/addons/prometheus.yaml
After the service is installed, run the following command to check that the pod related to Prometheus is running.
kubectl get pods -n istio-system
Setting up Grafana
Grafana - an open source monitoring solution that can be used to configure dashboards for Istio. You can use Grafana to monitor the health of Istio and of applications within the service mesh.
Run the following command to setup Grafana.
kubectl apply -f https://raw.githubusercontent.com/istio/istio/release-1.14/samples/addons/grafana.yaml
After the service is installed, run the following command to check that the pod related to Grafana is running.
kubectl get pods -n istio-system
To access grafana UI run the following command
kubectl port-forward svc/grafana 3000:3000 -n istio-system
Now you should be able to access grafana at http://localhost:3000
Setting up Kiali
Kiali - an observability console for Istio with service mesh configuration and validation capabilities. It helps you understand the structure and health of your service mesh by monitoring traffic flow to infer the topology and report errors. Kiali provides detailed metrics and a basic Grafana integration, which can be used for advanced queries. Distributed tracing is provided by integration with Jaeger.
Kiali with istio needs a small modification before its deployed. Download the kiali.yaml file to your local desktop. Edit the file to add the grafana url as it is not configured by default.
Under the kiali ConfigMap->data->external_services add the following (search for external_services in the kiali.yaml file and append the content)
    external_services:
    ....
      istio:
        root_namespace: istio-system
      grafana:
        url: "http://grafana:3000/"
Now you can run the following command to deploy it.
kubectl apply -f kiali.yaml -n istio-system
After the service is installed, run the following command to check that the pod related to Kiali is running.
kubectl get pods -n istio-system
To access kiali UI run the following command
kubectl port-forward svc/kiali 20001:20001 -n istio-system
Now you should be able to access kiali at http://localhost:20001
Installing a Sample Application
Now we will try to install a sample application provided by Istio themselves called bookinfo.
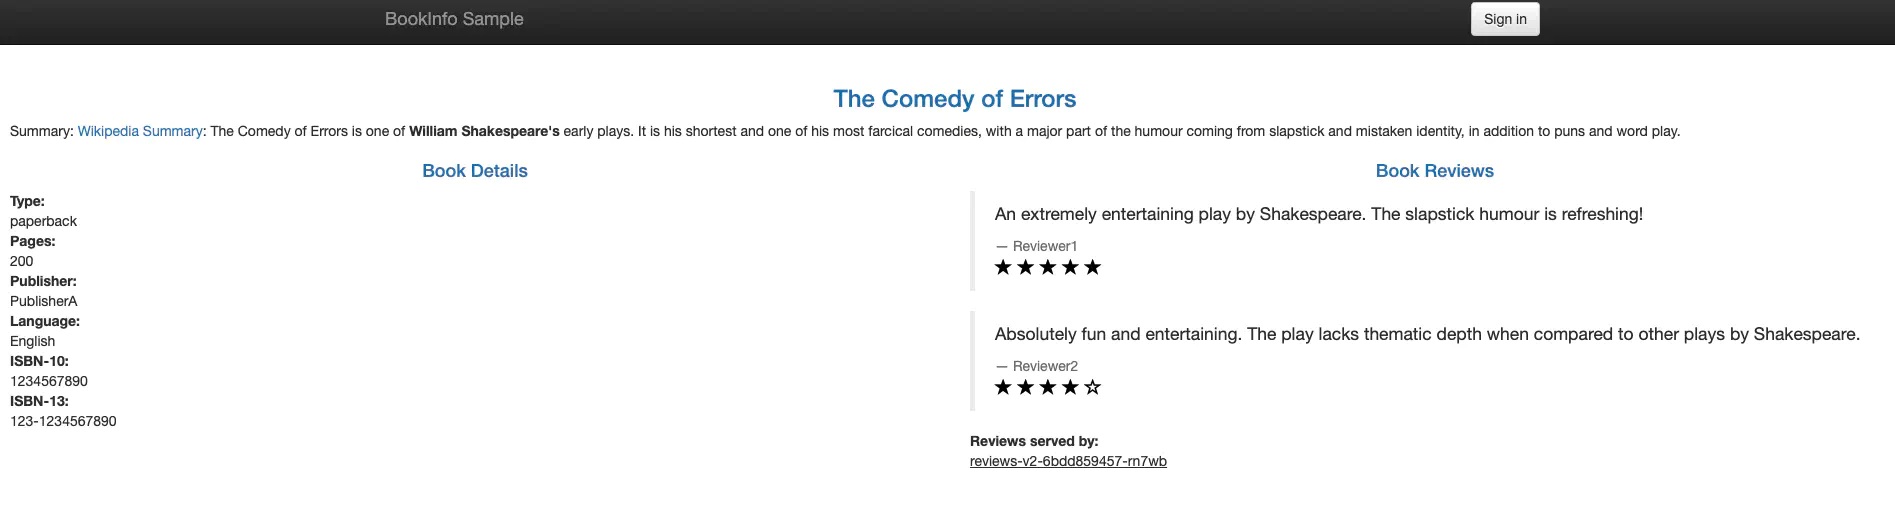
The sample application provides an example for 4 services the productpage, reviews, ratings and details.
How services call each other is as shown below.
- productpage -> details
- productpage -> reviews -> ratings
Lets follow the steps below to install the service.
Enable istio on the default namespace where we will deploy the bookinfo microservice using the command below.
kubectl label namespace default istio-injection=enabledDeploy the bookinfo sample application using the following command
kubectl apply -f https://raw.githubusercontent.com/istio/istio/release-1.14/samples/bookinfo/platform/kube/bookinfo.yamlPort forward the application on the local machine and access the application on http://localhost:9080/productpage?u=normal
kubectl port-forward svc/productpage 9080:9080
Once you have created the application, you can generate some load on the application. You will be able to see the details on the kiali dashboard as shown below.

Ensure the following.
- You have selected the default namespace
- Under display, you have selected the Response Time, Throughput, Traffic Distribution, Traffic Rate, Traffic Animation options.
Here is a sample python script to generate load, one request per second.
import time
import requests

url = 'http://localhost:9080/productpage'

for lp in range(1000):
    print(lp)
    try:
        headers = requests.utils.default_headers()

        headers={'User-Agent': 'Mozilla/5.0 (Windows NT 10.0; Win64; x64) AppleWebKit/537.36 (KHTML, like Gecko) Chrome/102.0.0.0 Safari/537.36'}

        response= requests.get(url.strip(), headers=headers, timeout=10)
    except:
        print ("An error occurred")
    time.sleep(1)
Save the script in a file called ‘urlhit.py’ and run the same using
python3 urlhit.py
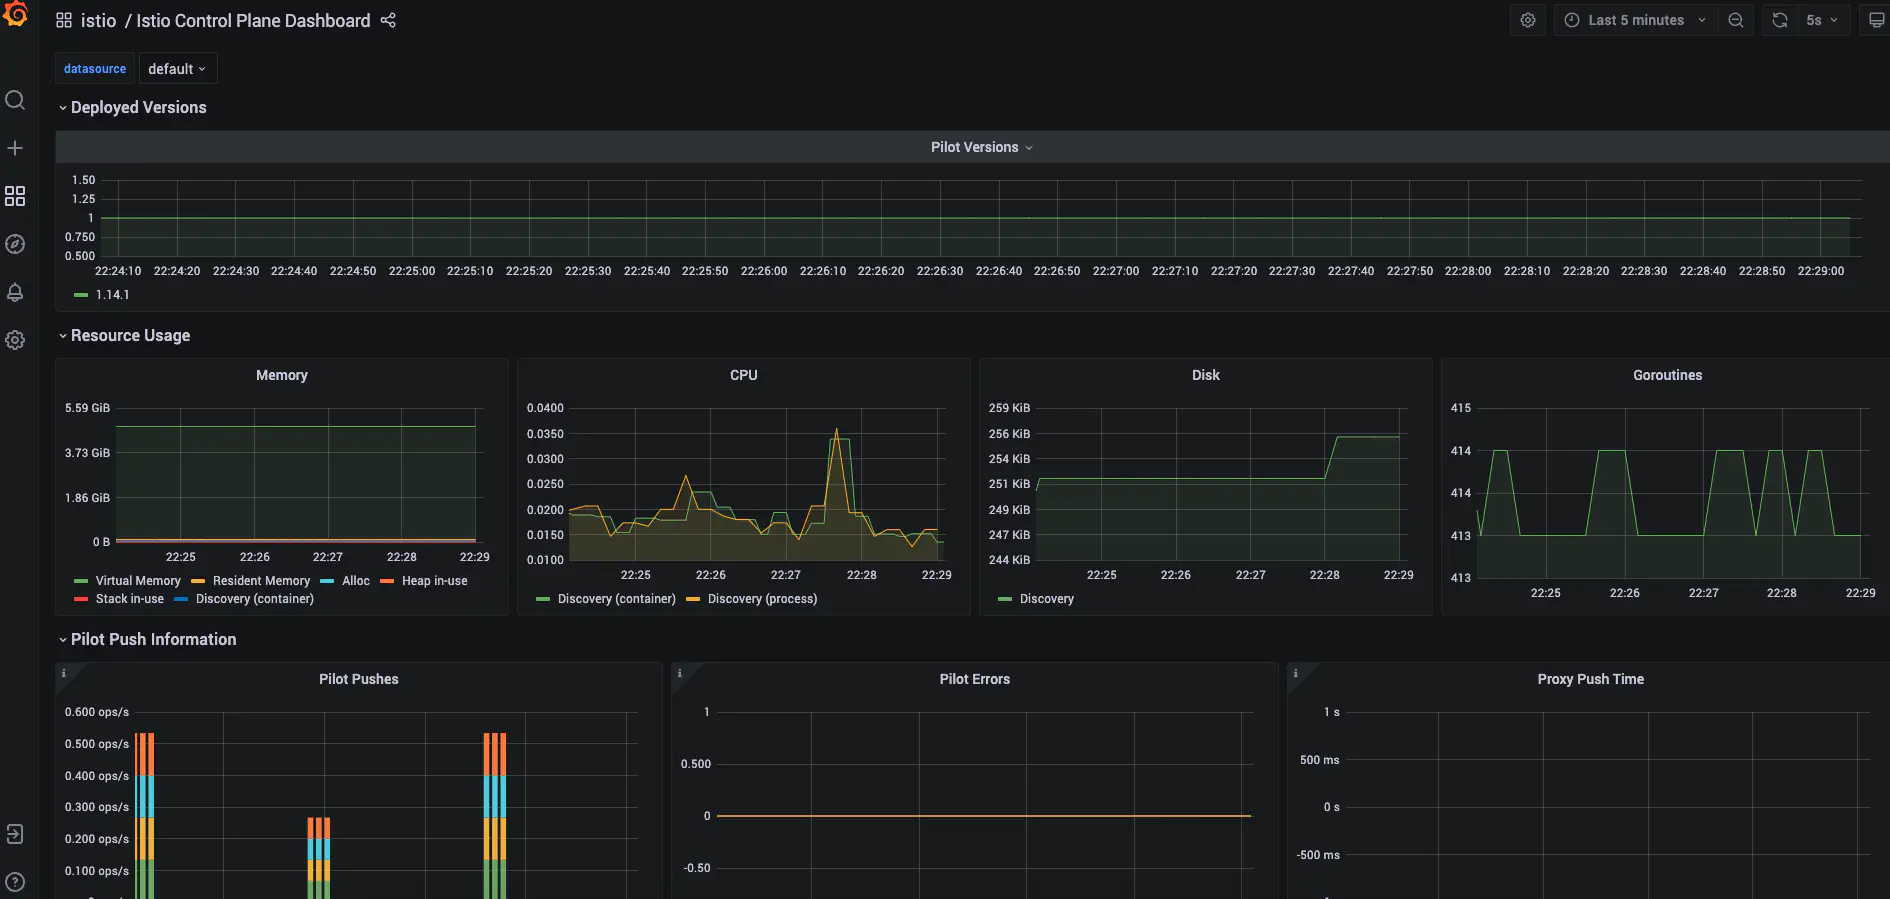
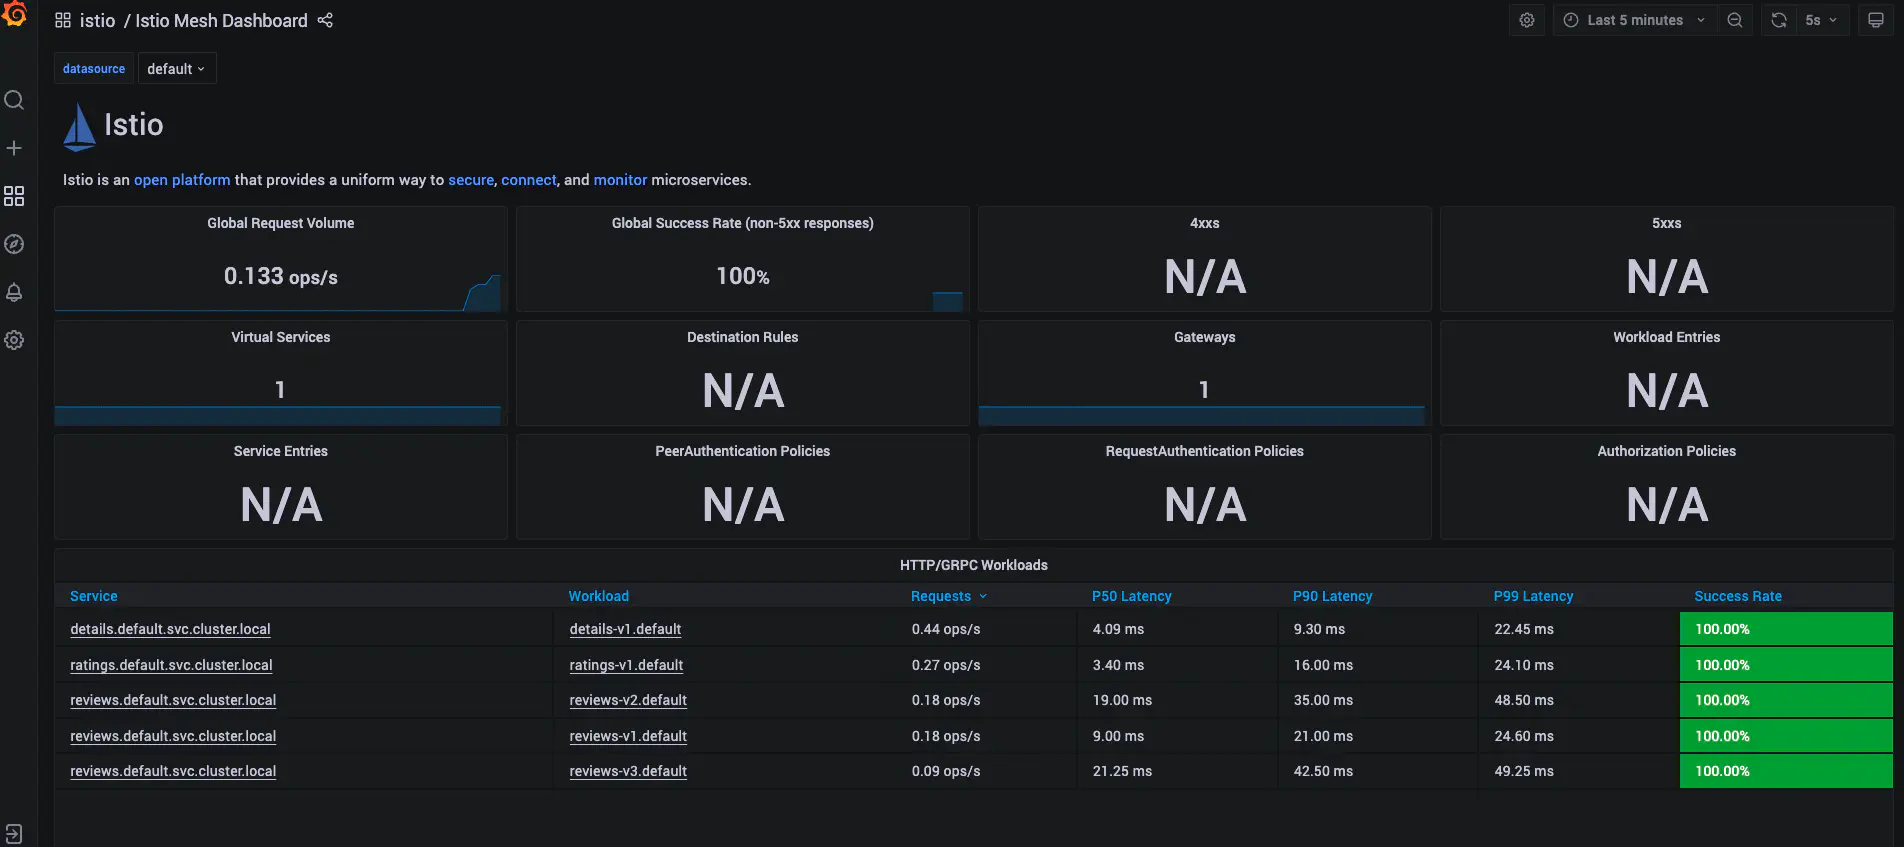
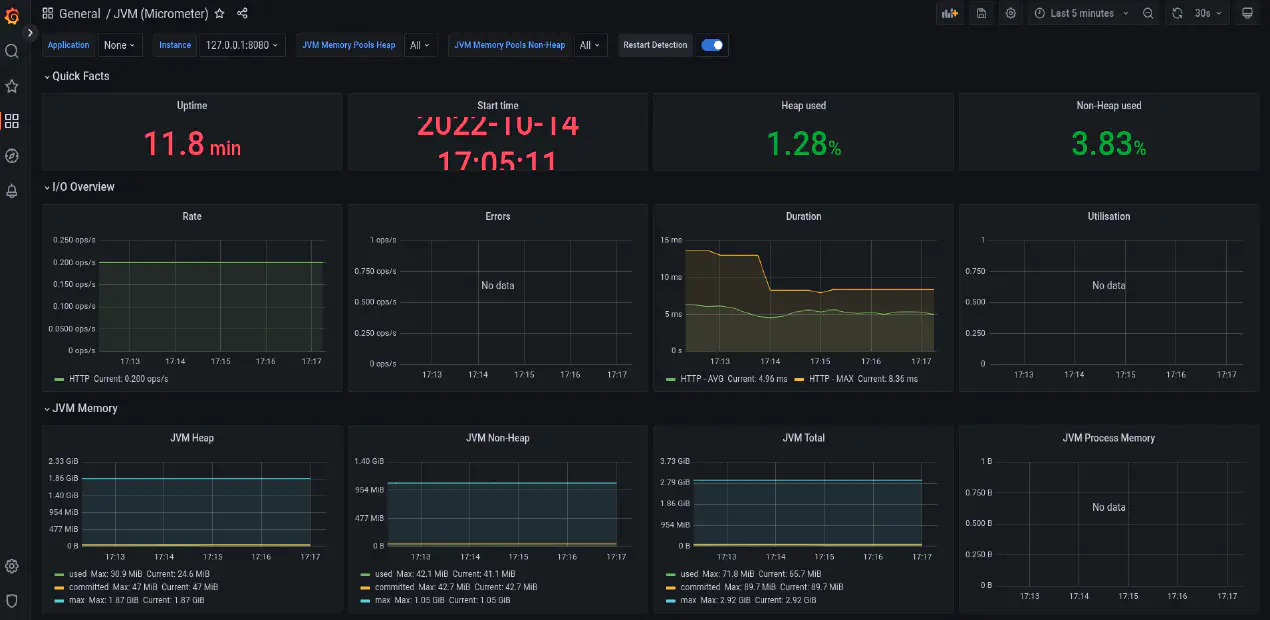
You can also check the grafana dashboards where you can see the required metrics related to SRE under the istio folder. Here is a glimpse of how it would look.